Zillow does not provide a crime map or offer integrated features for viewing crime trends or statistics in neighborhoods or surrounding areas of listed properties. Users interested in crime data must consult external resources such as local police websites, online crime mapping services, and neighborhood watch groups.
This article will explore whether Zillow offers crime data and crime statistics. It will also overview alternatives for locating crime hotspots and examine why it’s critical to research crime before purchasing property. Finally, we’ll discuss how to locate secure housing on Zillow without an integrated crime map.
Is There a Crime Map Available on Zillow?
Zillow does not currently offer an integrated crime map feature allowing users to view crime trends across neighborhoods. Their competitor Trulia previously provided crime maps on their platform but removed this capability in 2022.
Most major real estate sites shy away from offering crime maps due to concerns about:
Perpetuating racial bias by emphasizing crime rates in minority neighborhoods
Presenting inaccurate crime data that does not reflect actual safety levels
Violating local regulations about publishing crime statistics
Zillow does not provide general crime rates or crime statisticsfor listed properties or surrounding areas. Some user reviews may mention safety concerns anecdotally, but there is no centralized, standardized crime data.
Without an integrated crime map, those searching for homes on Zillow will need to consult external resources to research local crime levels.
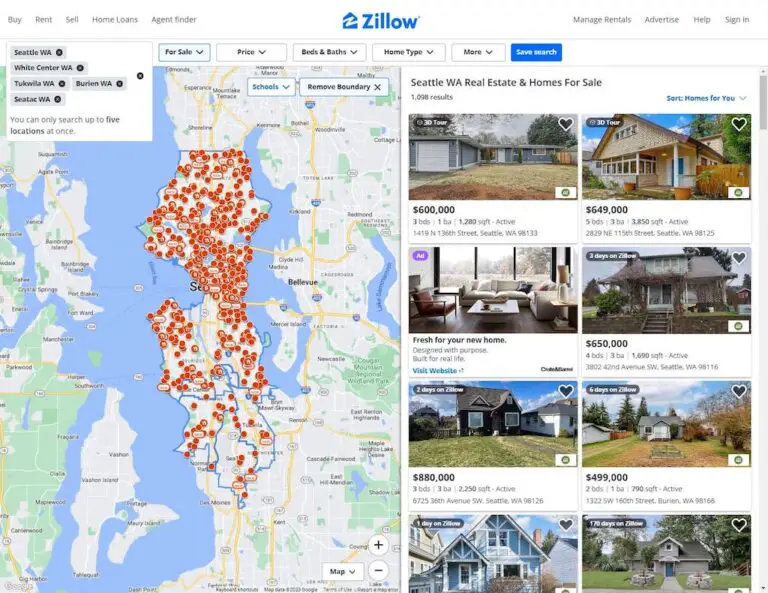
How to Find Crime Information on Zillow
While Zillow does not have a crime map feature, users can still find information related to safety when viewing listings. Here are some tips:
Read user reviews – Previous tenants or locals may mention crime problems or safety precautions in their comments. This provides helpful qualitative insights.
Study photos and descriptions – Listings with security systems, gated entrances, doormen etc. often promote these in listings. This suggests the area prioritizes safety.
Utilize keywords – Try searching using terms like “secure building”, “low crime” or “safe neighborhood” to filter for safer listings.
Enable crime alerts – Zillow’s mobile app can send notifications about recent crimes in your searched areas.
Take virtual tours – Zillow’s 3D home tours allow you to assess security features before visiting in person.
While not comprehensive, these approaches can provide some initial crime insights when searching Zillow.
Alternatives for Finding Crime Maps and Data
To thoroughly evaluate crime risks in a given location, real estate searchers will need to consult external crime resources. Some good alternatives include:
1. Local Police Websites
Many police departments publish crime reports and statistics on their websites. These provide official crime data directly from the source. For example, sites like CrimeMapping.com aggregate data from local police sites.
2. Online Crime Mapping Services
Third party services like SpotCrime or CrimeReports gather crime data from police and public records. They provide interactive crime map overlays for addresses or neighborhoods.
3. Neighborhood Watch Groups
Local neighborhood watch organizations often compile crime reports from residents. Nextdoor or Facebook groups provide hyperlocal qualitative crime insights.
4. Social Media Groups and Forums
City-specific Reddit or Facebook groups often discuss crime occurrences. Neighbors may share recent crimes or safety concerns.
5. Real Estate Agent Insights
Experienced real estate agents tend to have extensive knowledge of local crime rates. Discussing safety with an agent is a great way to get insider information.
Why is it Important to Check the Crime Rate Before Buying a Property?
Researching the local crime rate should be a priority when searching for a home for several key reasons:
Personal safety – Ensuring your personal security and minimizing risk of being victimized is a basic need. Crime stats help identify safer areas.
Home values – High crime depresses home values significantly, reducing resale potential and equity. One study estimated U.S. homeowners lost $2 billion in equity annually due to crime.
Legal obligations – In some states, sellers must disclose recent criminal occurrences to home buyers, but it helps to be proactive.
Insurance rates – Crime rates directly impact the cost of homeowners insurance. Higher crime areas have higher premiums.
Quality of living – Frequent crime creates an uncomfortable, stressful environment for residents and reduces livability.
School performance – High crime areas tend to have lower performing schools, an important factor for families.
Taking the time to thoroughly research crime rates allows buyers to make prudent, informed decisions ensuring their safety and investment.
How Accurate are Online Crime Maps?
While online crime maps provide a useful starting point, it is important to understand their limitations when evaluating how safely an area actually is. Some key considerations on accuracy include:
Reporting inconsistencies – Not all crimes get reported, skewing crime map data. Some neighborhoods are more diligent about reporting.
Data lag – Online maps may not reflect the most recent crime occurrences. Always check the time period reflected.
Hyperlocal variations – Crime concentrated on a few specific blocks may not show up in neighborhood-level data.
Population density – More populated areas logically have higher total crimes. Look at crime rates per capita.
Personal risk factors – Your individual risk profile based on behaviors and demographics affects safety more than aggregate crime data.
Perceptions vs. reality – Some residents feel unsafe due to perceived crime that statistics do not support.
While helpful, online crime maps provide general trends but should not be solely relied upon to assess safety. Combining statistical data with your own on-site visits and insights is recommended.
Limitations of Online Crime Maps
Despite the rise of online crime mapping tools, they come with some inherent limitations users should keep in mind:
Accessibility issues – Not everyone can access apps and websites hosting crime maps, skewing their usefulness.
Reliance on limited data sources – Most crime maps only incorporate police data, omitting unreported crimes.
Privacy concerns – Some oppose publishing detailed crime data which could reveal victims’ identities or stigmatize communities.
Promoting harmful stereotypes – Emphasizing high crime areas on maps may reinforce racial or economic prejudices.
Limited prevention impact – Crime maps raise awareness but may not lead to meaningful preventative action.
Inability to capture causes – Maps don’t explain socioeconomic factors contributing to crime like poverty.
Outdated information – Online crime data often lack real-time insights on emerging crime patterns.
Inconsistent methodologies – Not all maps use the same defined parameters for reporting crimes consistently.
While valuable, users should keep these constraints in mind and not consider crime maps the sole indicator of an area’s safety.
Understanding the Impact of Crime Rates on Property Values
Crime rates can significantly impact property values, home equity, and by extension, home prices. According to research:
Violent crimes like robbery and homicide reduce property values more substantially than non-violent theft, though both are detrimental.
Houses within 0.1 miles of registered sex offenders sold for approximately 2.3% less on average, equating to $3,500 per home.
Precise crime hotspots on individual blocks affect prices more than general high crime areas. Being very localized to crime lowered values.
Home prices are typically lower in disadvantaged urban areas with higher poverty, unemployment, and income inequality rates which contribute to crime.
Increased affordable housing has been found to decrease local crime rates while raising surrounding property values.
School shootings erode local property values, with one study finding a 2.4% price reduction in the 4 years after.
Overall, higher crime rates consistently translate to reduced demand, lower prices, and decreased equity for homeowners in affected markets.
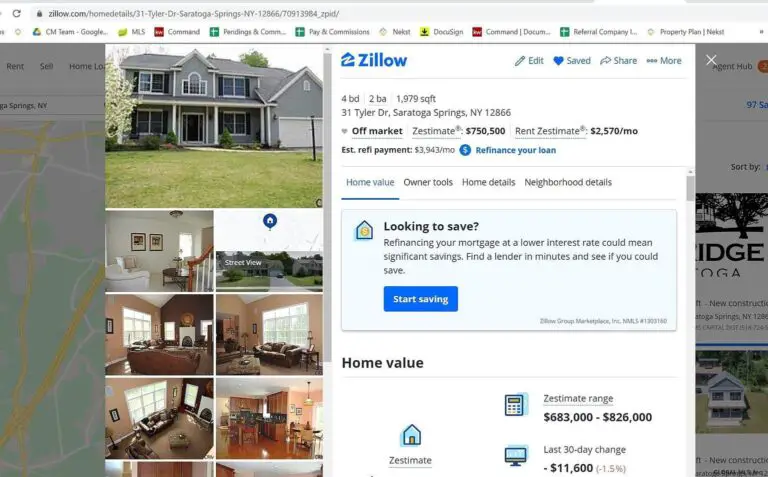
Can You Trust the Information Provided by Zillow?
Zillow collates property listing data from a variety of sources, including brokers and MLS databases. However, they do not vet or confirm the accuracy of all listings. Issues to keep in mind:
Listing details like square footage, bedroom count, and amenities may be exaggerated or incorrect. Always verify.
Pictures may misrepresent properties or neighborhood conditions. Nearby decay or crime may be omitted.
Zestimates are educated guesses of market value but should not replace appraisals. Recent sale prices give better value insights.
Agent reviews of properties could be biased or fake. Balance with objective local information.
Listings may mislead about proximity to offenders or crime rates. Verify using proper crime maps.
Sponsored listings that pay for placement could downplay risks like recent crimes.
While a useful real estate searching tool, Zillow alone should not determine homebuying decisions. Combining it with objective crime data gives a clearer picture.
Conclusion
While Zillow does not currently provide an integrated crime map, home shoppers can still utilize the platform to find safe housing options. Focusing searches using security-related keywords, studying listing details, reading community reviews, and taking 3D virtual tours allows buyers to get a preliminary sense of property safety.
However, to get the full picture, one should cross-reference Zillow listings with detailed crime statistics from local police, online crime mapping tools, neighborhood groups, and real estate professionals. Limitations exist, but used judiciously, these resources empower home seekers to make informed decisions and avoid high crime areas that could endanger their families and erode their property investments.
Being proactive by thoroughly researching crime rates continues to be a crucial part of securing the ideal living situation. In time, as concerns about biases and privacy evolve, platforms like Zillow may again provide integrated neighborhood safety tools. For now, external due diligence is required by thoughtful home buyers prioritizing safety and value stability for themselves and their families.
Frequently Asked Questions(FAQ)
Why did Realtor com remove the crime tab?
Realtor.com removed the crime tab due to concerns about the accuracy of the data and its potential to unfairly stigmatize certain neighborhoods. Realtor.com found that the data was not always up-to-date or comprehensive enough to be an accurate representation of crime levels in a given area. Additionally, the data could be used to paint an overly negative picture of certain neighborhoods, leading to unfair generalizations. As a result, Realtor.com decided to remove the crime tab in order to ensure that its data was of the highest quality and to avoid perpetuating any unfair stereotypes.
What happened to the crime overlay on realtor com?
In May 2020, the crime overlay feature on realtor.com was removed following criticism that it was inaccurate and could lead to discriminatory practices. The feature had allowed users to search for properties based on crime data, but was found to be misleading as it was based on outdated information. The National Association of Realtors (NAR) stated that the feature was removed in order to promote fair housing and ensure that users have access to accurate, up-to-date information.
What do the colors mean on a crime map?
Crime maps use colors to indicate the type and severity of crime in a given area. Red is typically used to denote the highest levels of crime, such as homicides and assault, while yellow is used to indicate lower levels of crime, such as vandalism or theft. Blue indicates areas with no reported crime. Orange is often used to indicate areas with a higher than average rate of crime, while green indicates areas with a lower than average rate of crime.
What is the best response to questions regarding neighborhood safety?
The best response to questions regarding neighborhood safety is to research the area and learn about the crime rate, local law enforcement, and any safety initiatives in the area. Additionally, it is important to make sure to take basic safety precautions such as locking doors, avoiding walking alone at night, and being aware of one’s surroundings. Lastly, it is important to stay informed of any changes in the neighborhood by staying in contact with local law enforcement and other safety organizations.